|
<< Click to Display Table of Contents >> XY chart |
  
|
|
<< Click to Display Table of Contents >> XY chart |
|
Property |
Description |
|---|---|
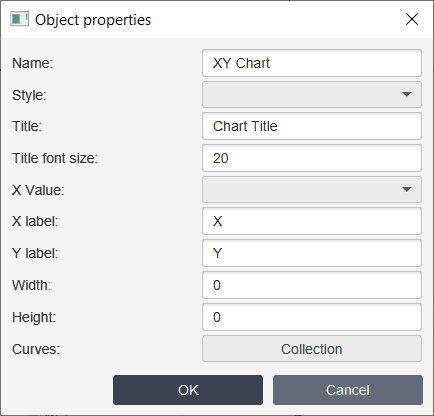
Title |
Title of the chart. |
Title font size |
Font size of the title's text. |
X value |
Choose column for X axis. |
X label |
Enter label for X axis. |
Y label |
Enter label for Y axis. |
Height |
Height of the chart. |
Width |
Width of the chart. If you specify "0", the object will automatically stretch to the entire width of the page. |
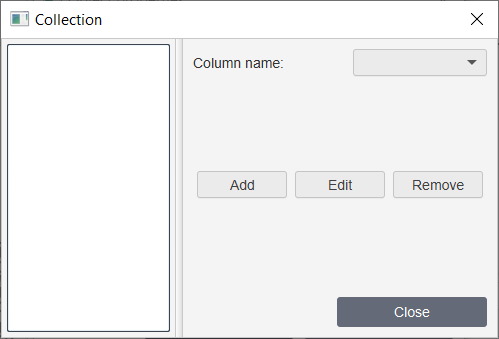
Curves |
Click Collection to set up chart's curves. After clicking you’ll see the window:
where: ▪Column name - name of the column bind to the curve. |