|
<< Click to Display Table of Contents >> Industry DB Trend |
  
|
|
<< Click to Display Table of Contents >> Industry DB Trend |
|
This section applies to the following object: Industry DB Trend.

Let's look at the "General" properties of this object (properties not listed in the table are common to all objects, you can read about them here).
Property |
ST script field |
Description |
|---|---|---|
Title |
charttitle |
Title of the chart. |
Fill |
fill |
Select fill or not fill trend. |
Fill color |
fillcolor |
Fill color of the trend. |
Curves |
|
After clicking Collection you’ll see window:
where: ▪Tag - tag that you want to bind to this curve. ▪Name - name of the curve. ▪Line with - curve's line width. ▪Color - curve's line color. ▪Type - line's type: ✓Type 1 - just draw the line. ✓Type 2 - draw line with filling till axis X. ✓Type 3 - draw a ladder line. ✓Type 4 - draw a filled histogram. ✓Type 5 - draw the line with smoothed effect (don't use for big amount of history data). ✓Type 6 - draw only dots. ▪Draw marker - draw marker of the points. ▪Use axis - use its own axis for this curve. ▪Y label - use Y label for this axis. ▪Side - side of the axis displaying - Right or Left. ▪Auto range - check if Y axis is auto ranging. ▪Maximum - maximum of axis range (if not auto ranging). ▪Minimum - minimum of axis range (if not auto ranging). |
Periods |
|
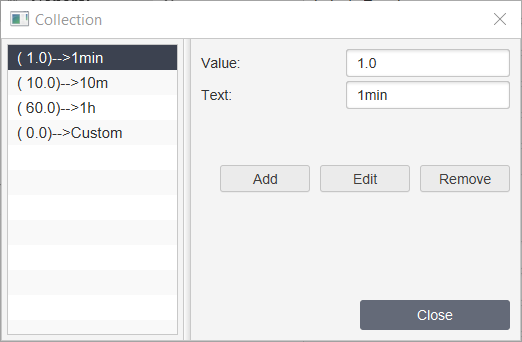
Periods of trend will be shown on the top of Trend. By choosing period you'll get trend's curves between now and now minus setup values in minutes. If you set 0 in the value you can choose custom period.
where: ▪Value - period in minutes. ▪Text - label that will be shown for this value. |
Animation |
|
Check if you want to use animation in Industry trend. |
Auto refresh |
autorefresh |
Check it if you want to auto refresh HTTP history DB trend. |
Also Trend object has several properties that you can’t setup by using settings dialog window, but you can setup by using ST script:
•begin - start time for trend information. Time is represented in minutes from current period. (start time = current time - begin).
•end - finish time for trend information. Time is represented in minutes from current period. (finish time = current time - end).
•title - title for the trend’s report representation.
•filename - name of the report’s file.
•number - report’s frequency of writing values.
•savereport - when this value become true trend’s report will be created.
•begindatetime - start time for trend information. Time is represented in milliseconds from 1 January 1970.
•enddatetime - finish time for trend information. Time is represented in milliseconds from 1 January 1970.
•disablesavereport - disable "Save report" button in the dialog.
•disableprint - disable "Print" report button in the dialog.
Properties from the "Grid" tab are described here.
Properties from the "Fill Color" tab are described here.
Properties from the "Flash" tab are described here.
Properties from the "Rotation" tab are described here.
Properties from the "Motion" tab are described here.
Properties from the "Visibility" tab are described here.